CERN is the European Council for Nuclear Research, an organisation dedicated to research into nuclear and particle physics. CERN was established in 1954 and is based near Geneva. It currently has 25 member states.
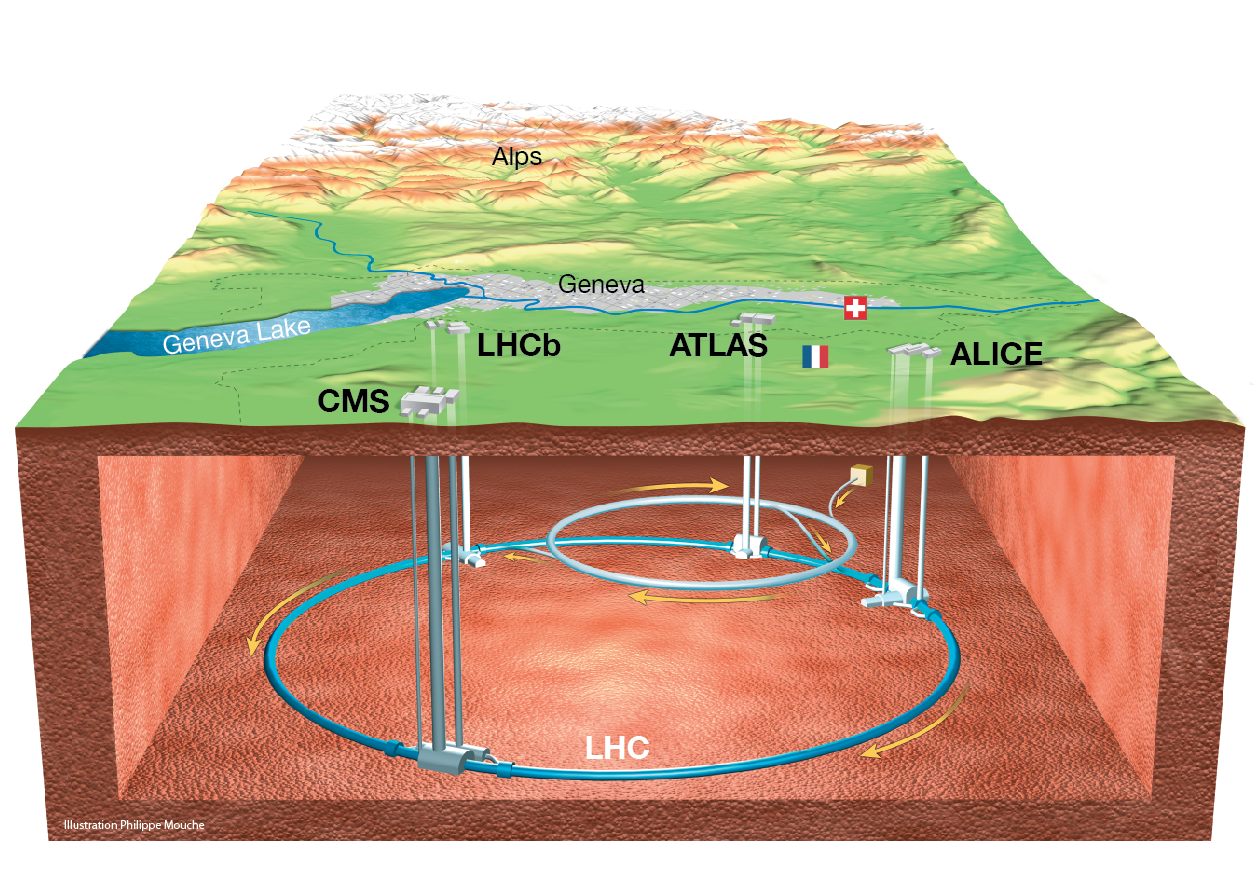
The Large Hadron Collider (LHC) is the world's largest and most powerful particle collider. It was built by CERN and is situated in a 27 km circular tunnel beneath the Franco-Swiss border. Magnets along the tunnel are used to guide protons The proton is a subatomic particle of positive charge made up of elementary particles called quarks along the tunnel and accelerate them to high speeds. When these high energy protons collide many particles are produced and among them, in rare cases, we may find supersymmetric particles. Four detectors The 4 detectors around the LHC are ATLAS, CMS, LHCb and ALICE. are placed around the tunnel to detect the outgoing particles from these collisions. The data collected from these detectors is used by physicists to understand the fundamental building blocks of matter.
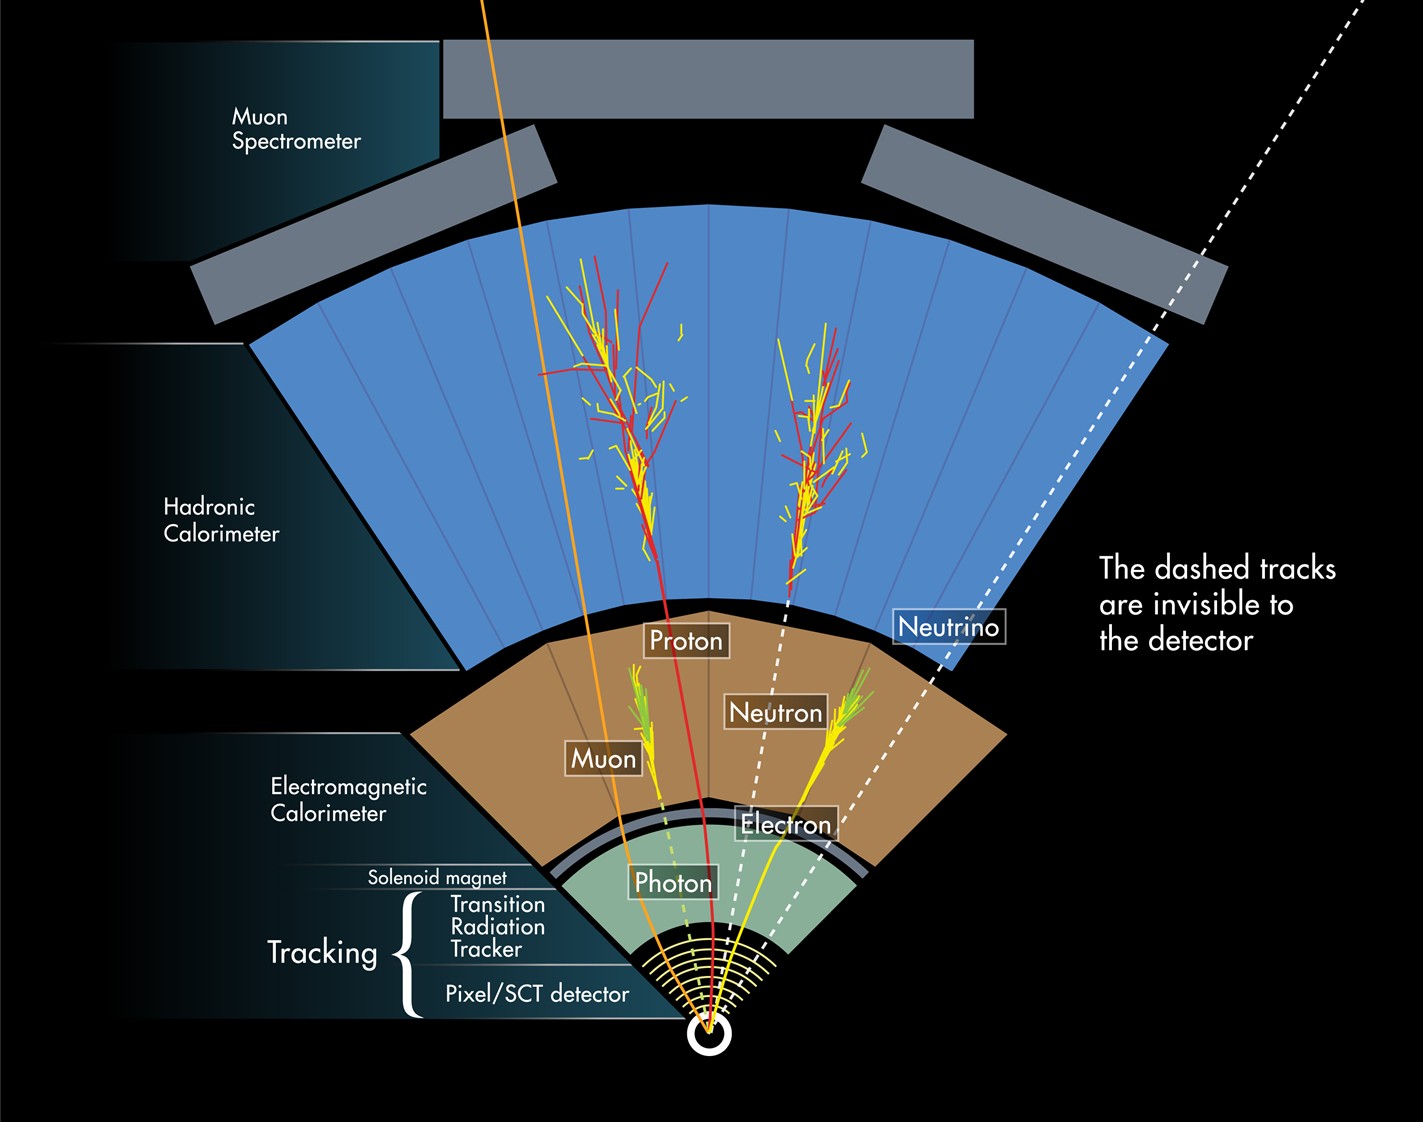
ATLAS is the largest of the four detectors around the LHC. It detects the products from proton-proton collisions. The figure on the right is a cross-section of the ATLAS detector. It is made up of multiple layers which are sensitive to different particles:
ATLAS can detect the decay products of a particle and reconstruct their invariant mass, The invariant mass of a system is the part of its mass that is independent of the motion of the system which should match the invariant mass of the original particle. Elementary particles cannot be observed directly because they are incredibly small, A proton is about 10-12 millimeters and electrons and quarks are even smaller and some of them also have very short lifespan; Higgs Boson has lifespan of ~ 1.6 x 10⁻¹⁹ milliseconds instead, they are identified through the properties of their interactions with the detector and through the particles into which they decay. Modern detectors such as ATLAS are designed to measure quantities like energy, momentum, electric charge, and the spatial trajectories of particles produced in high-energy collisions. From these measurements, physicists reconstruct the properties of the original particle.
One of the most important tools for particle identification is the invariant mass. If a particle decays into two or more detectable particles, the invariant mass calculated from the decay products should correspond to the mass of the original particle. This method is widely used to identify short-lived particles that decay almost immediately after being produced. In addition to invariant mass, particle identification relies on characteristic detector signatures. Charged particles leave tracks in magnetic fields, neutral particles may deposit energy without leaving tracks, and some particles penetrate deep into the detector while others are absorbed quickly. By combining all this information, physicists can determine which particles were present in the collision.
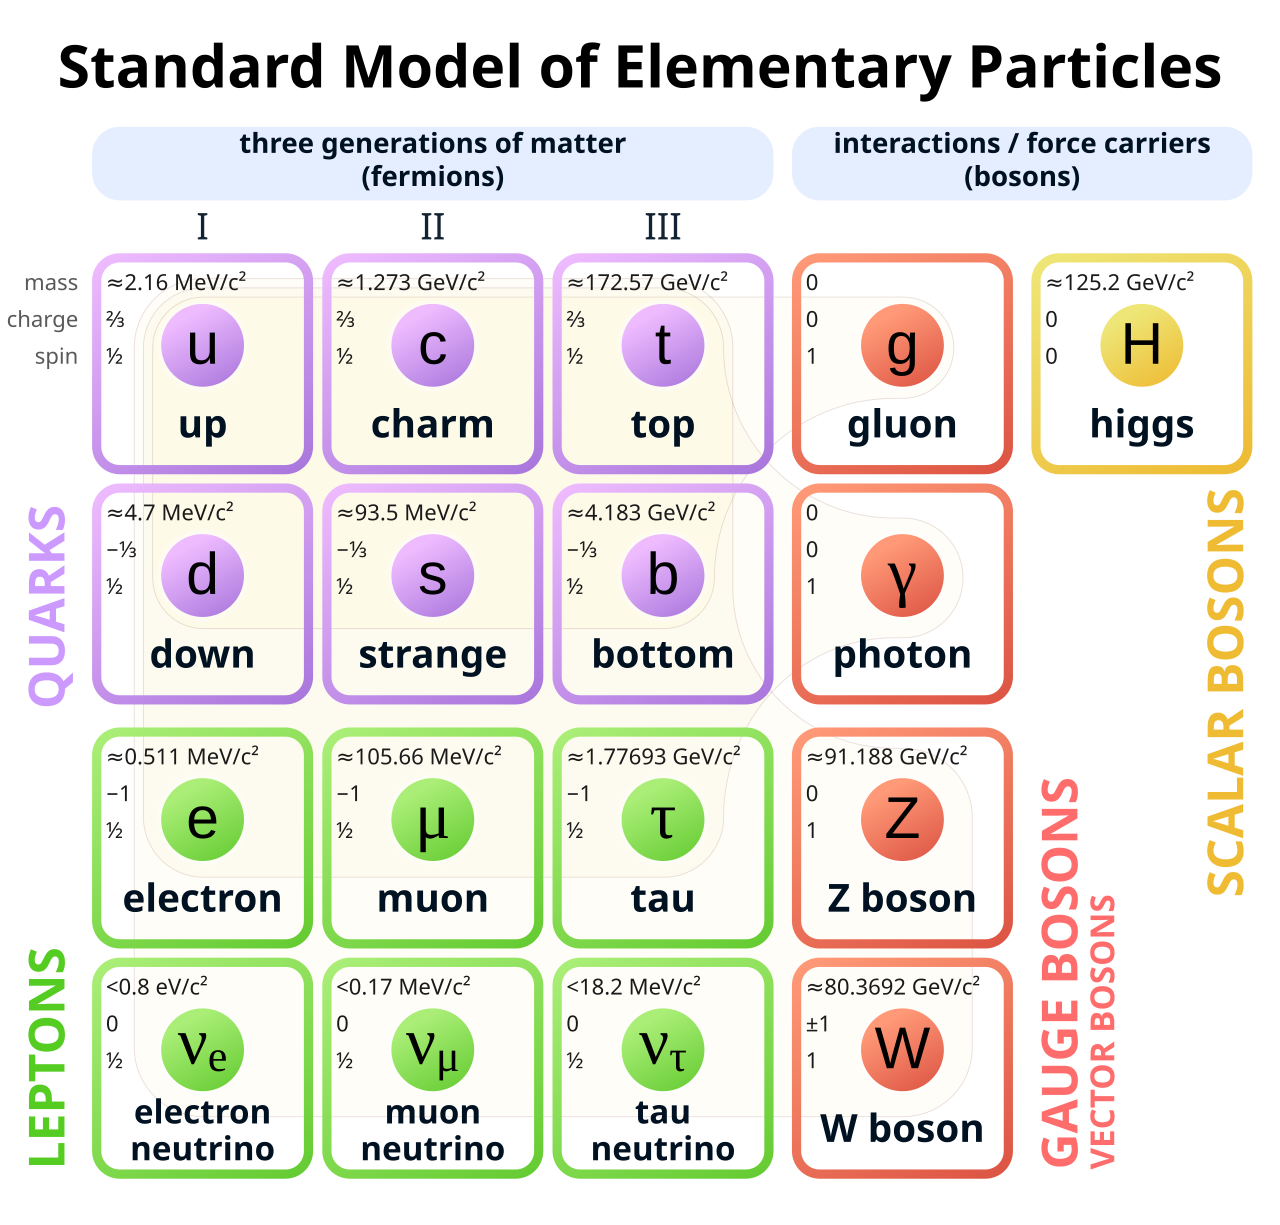
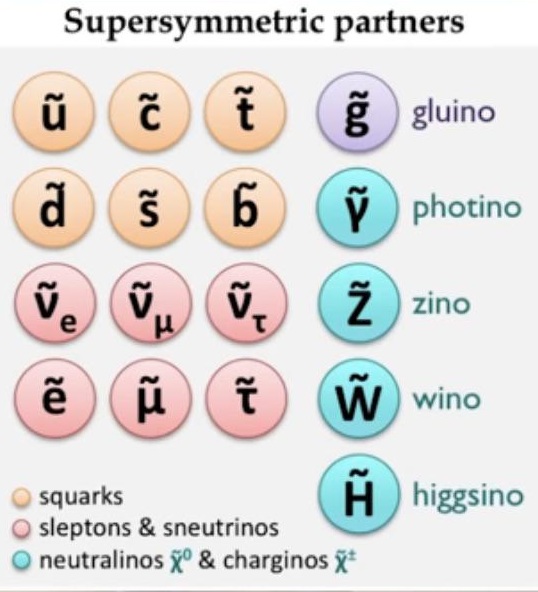
Supersymmetry is a theoretical extension of the Standard Model of particle physics that introduces a new type of symmetry between fermions and bosons. In the Standard Model, matter particles such as quarks and leptons are fermions and have a spin of 1/2, while force-carrying particles such as photons and gluons are bosons and have a spin of 1 For gluons, photons, Z and W bosons or 0. For Higgs Boson Supersymmetry proposes that for every known particle, there exists a corresponding partner particle whose spin differs by one half-unit.
These hypothetical partner particles, known as superpartners, have not yet been observed experimentally. One possible explanation is that supersymmetry, if it exists, is a broken symmetry, meaning that superpartners are much heavier than their Standard Model counterparts. As a result, producing them requires energies that are only now becoming accessible at the LHC.
Supersymmetry is motivated by several theoretical considerations discussed in modern particle physics, for example:
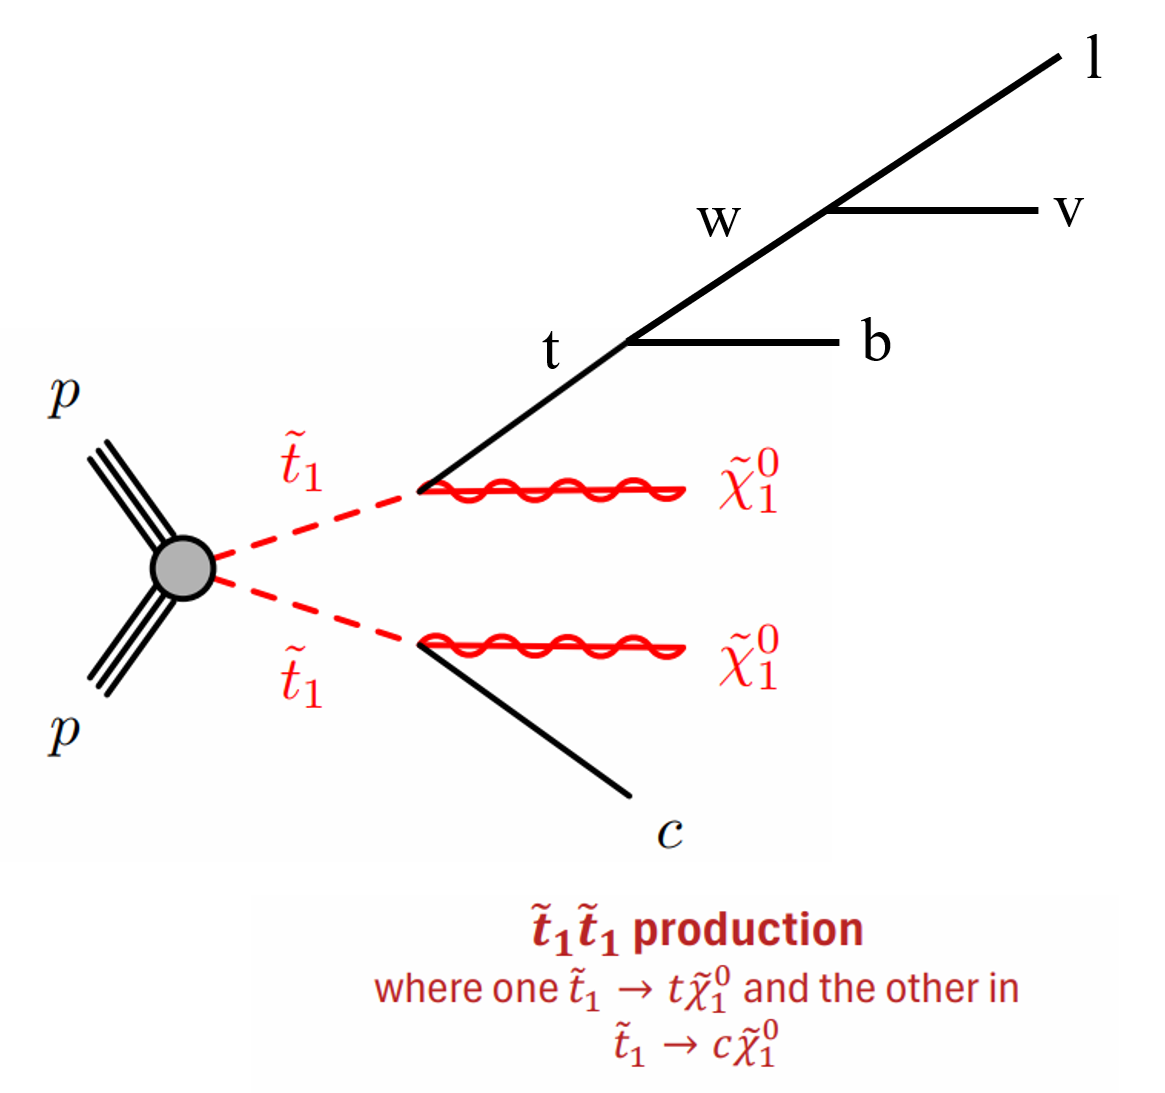
Feynman diagrams are a graphical representation of the mathematical expressions describing the behavior and interaction of subatomic particles. In a Feynman diagram, lines represent particles and vertices represent interactions. Time is conventionally taken to flow from left to right. Different types of lines correspond to different kinds of particles, such as fermions or bosons.
In searches for supersymmetry, Feynman diagrams are used to predict how superpartners would be produced in proton-proton collisions and how they would decay into Standard Model particles that can be detected and invisible ones.
On the right you can see the Feynman diagram that represents, what could happen if a supersymmetric particle - stop squark is produced in proton-proton collision. One of the stop squarks decays into top quark and a neutralino, while the other decays into a charm quark and a neutralino. Because top quark is unstable, it will very quickly decay into W boson and a botom quark. The W boson will then decay into a lepton (like electron) and a neutrino. At the end we will have particles that can be detected: electron, charm quark and bottom quark; and particles that can't be detected: neutrino and neutralino, that will be detected as large missing energy (MET).
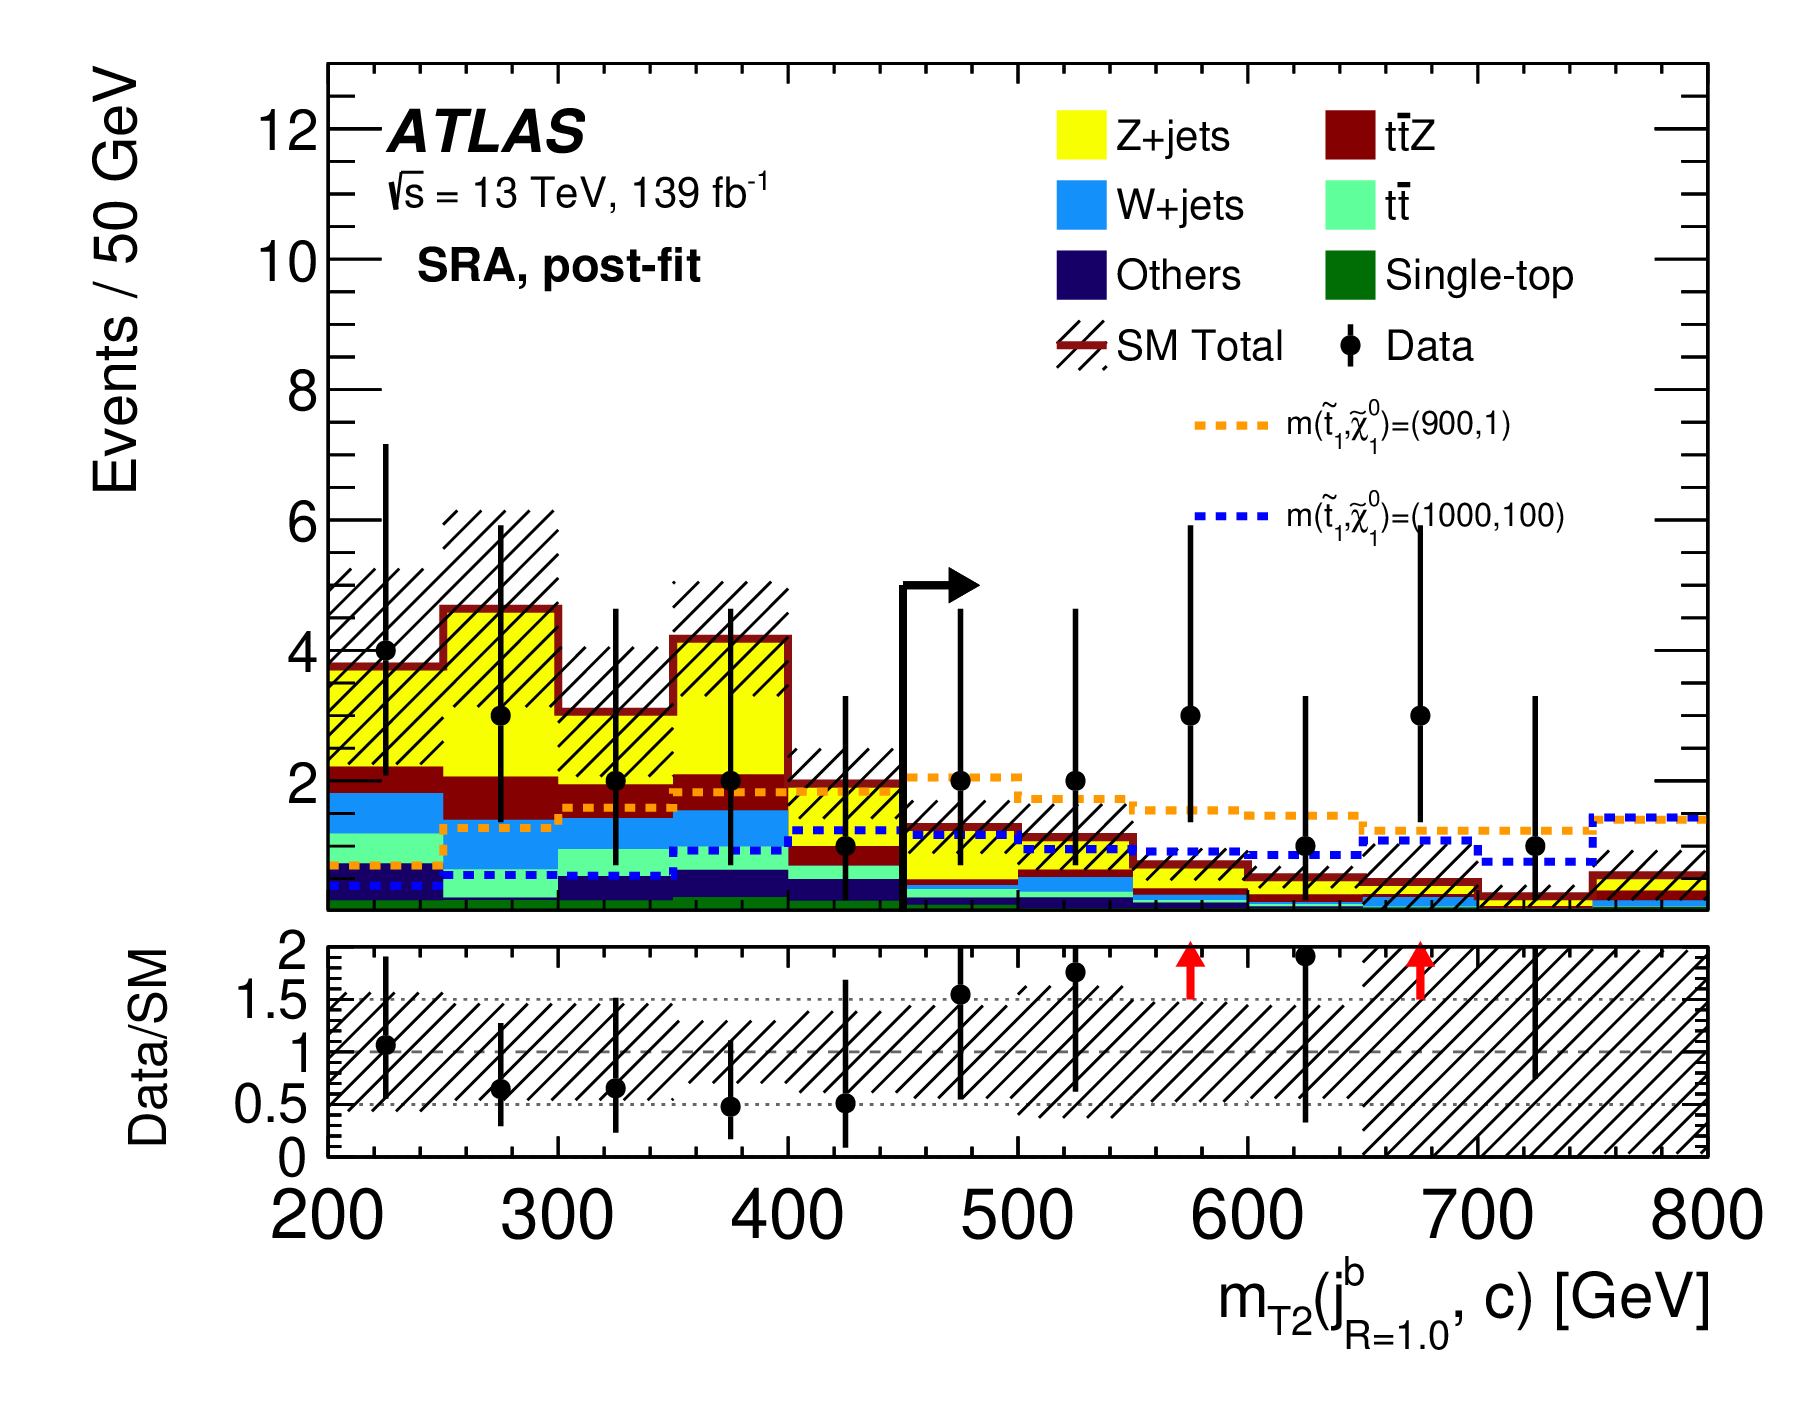
Histograms are one of the primary ways experimental results are presented in particle physics. They show how often a particular quantity takes a given value across many collision events. The horizontal axis represents a specific variable that was calculated from detector measurements, while the vertical axis represents the number of events falling within each range of that variable.
In the plot on the right, the horizontal axis corresponds to a mT2 variable, also called the "Stransverse Mass", which is an event variable used to bound the masses of an unseen pair of particles which are presumed to have decayed semi-invisibly into particles which were seen. Higher values of this variable are generally associated with rarer and more energetic events. The vertical axis shows the number of observed events per bin, with each bin being 50 GeV Electronovolt [eV] is a unit of energy used in particle and nuclear physics. It is an energy a particle with charge the same as electron gains in an electric field of 1 V wide. In High Energy Physics the speed of light — c is set to unity(1) and thus energy, momentum and mass generally units for mass are GeV/c2 have same units — GeV.
The colored stacked bars represent the expected contributions from known Standard Model processes, often referred to as backgrounds. These expectations are based on detailed simulations and theoretical calculations. The black points correspond to actual data collected by the detector, with error bars indicating statistical uncertainty.
The lower panel shows the ratio of observed data to the total Standard Model prediction. A ratio close to one indicates good agreement between data and known physics, while systematic deviations could indicate either problems with the model or the presence of new phenomena.
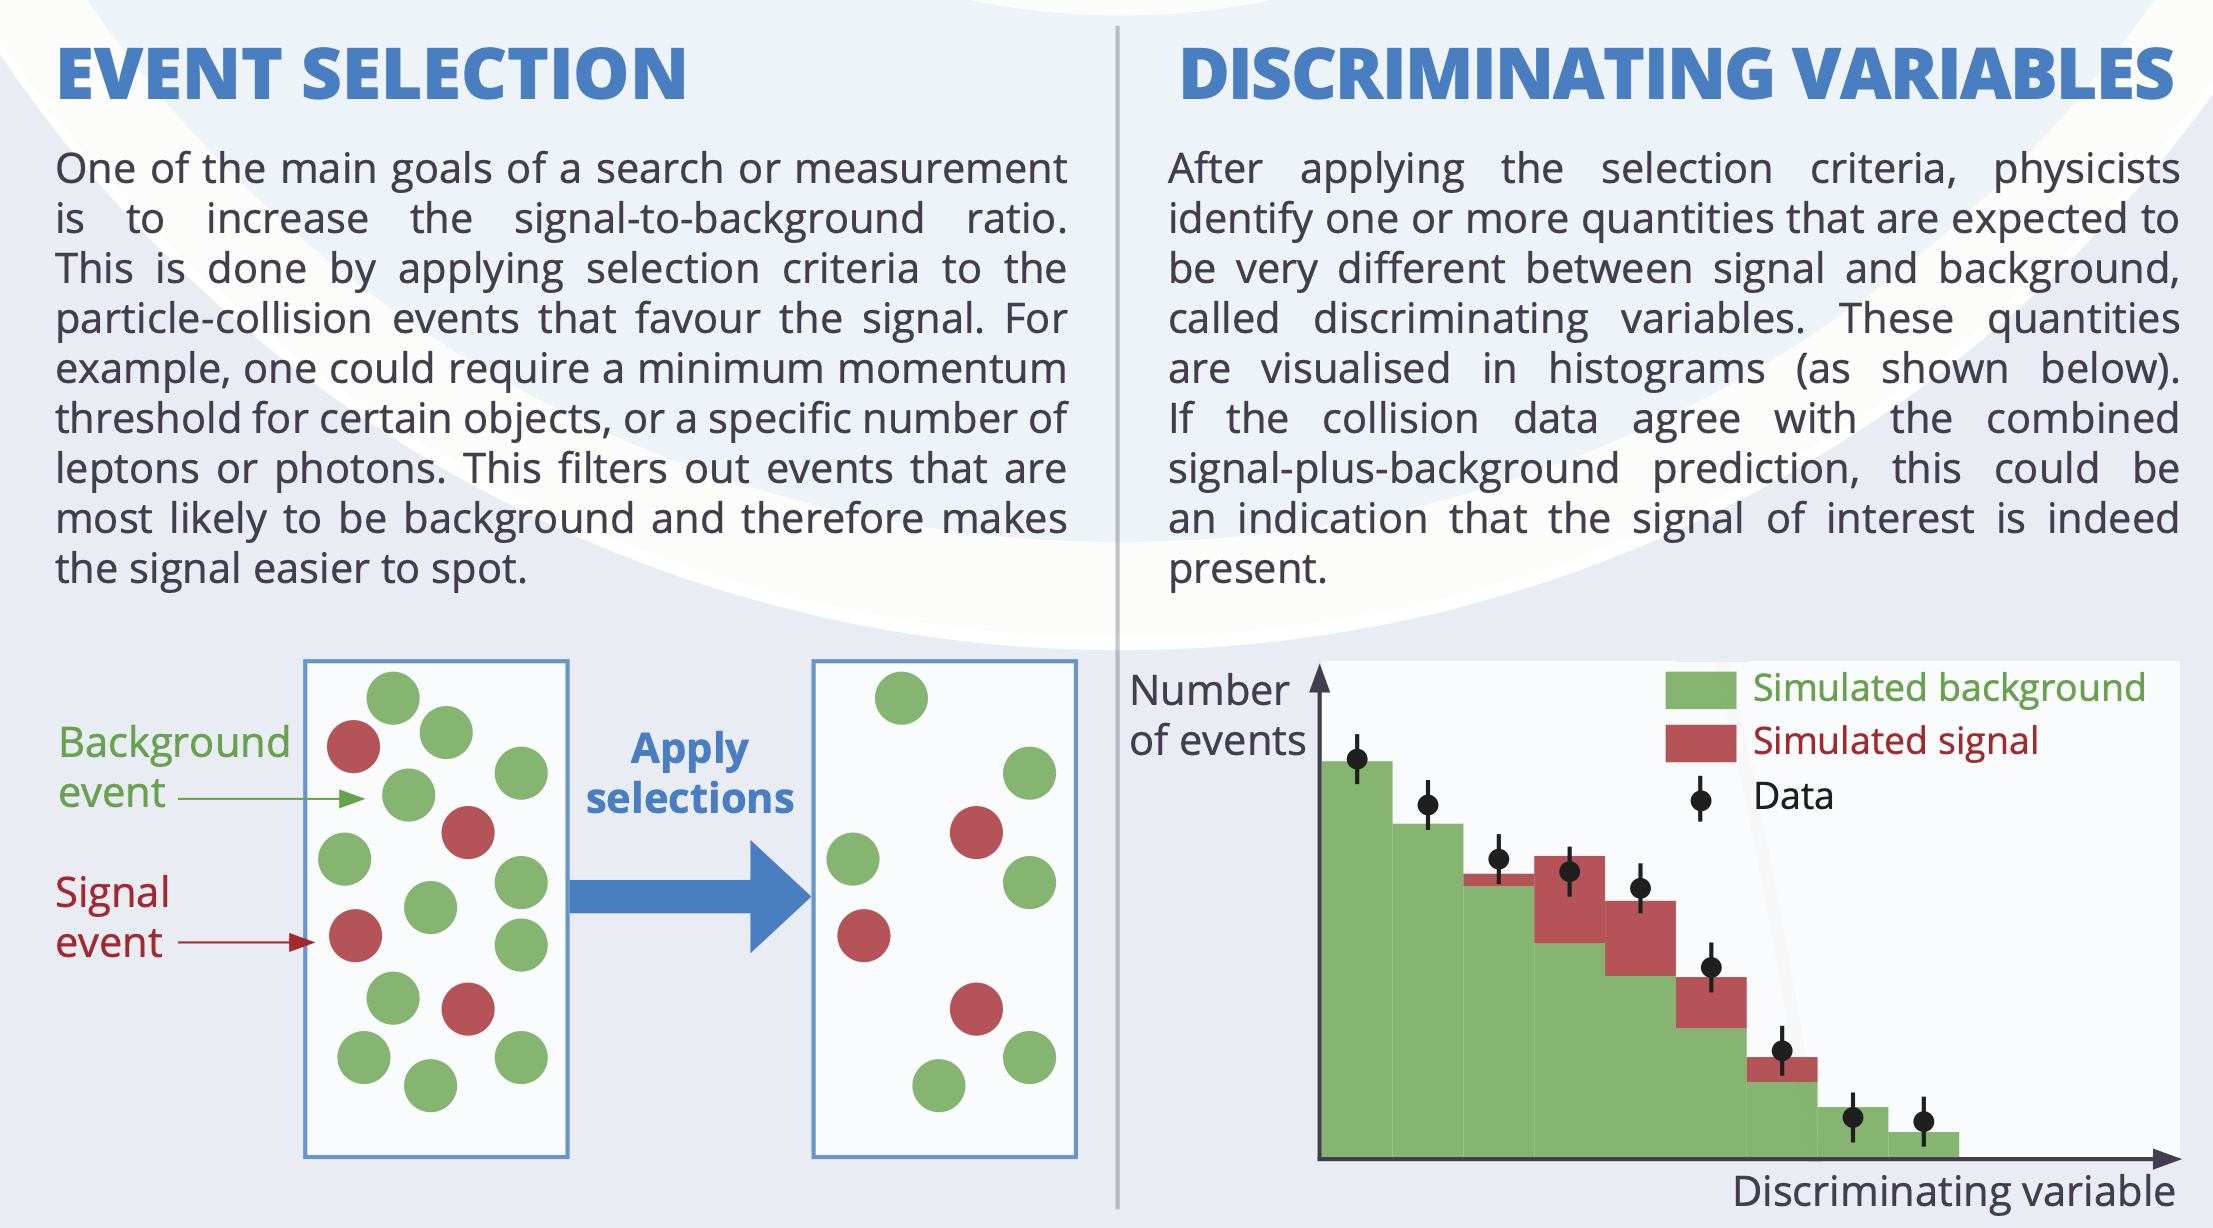
Cuts are an essential part of data analysis in particle physics. A cut is a selection criteria applied to experimental data in order to isolate events of interest. In practice, this means retaining only those events that satisfy certain conditions, such as having a variable above or below a specified threshold.
The main purpose of applying cuts is to reduce background processes that look similar to the signal that is being searched for. Most proton-proton collisions produce well-understood Standard Model events, while potential signals of new physics are rare. By selecting events with extreme or distinctive properties, such as large missing energy Usually called missing transverse energy or MET. It is the energy that was not detected by the detector. or high transverse In this context refers to being perpendicular to the direction of the proton beams, usually referres to X and Y, while Z is the direction of proton beams mass, physicists can increase their chances of finding possible new physics.
When a cut is applied to a histogram, bins that fall outside the selected region are excluded from the analysis. This reduces the total number of events but increases the sensitivity to processes involving invisible or unknown particles. In supersymmetry searches, cuts are designed based on theoretical expectations for how supersymmetric particles would appear in the detector.
Press the blue button below to access the simulation page which will walk you through the process of detecting a supersymmetric particle.
In this simulation you will recreate the histogram that contains real recorded data distribution that can be seen at the "How to read histograms?" section.
Pressing the "Fire" button will simulate a proton-proton collision event. Particles will apear on the detector and your task will be to select the ones that have the highest momentum. After that, you will measure their momentum and use it to calculate missing transverse momentum and energy. Then, missing transverse mass (transformed from calculated missing energy) will be added to the histogram on the right.
After all the events are added, you will be able to show the calculated signal and background as well as the error bars. Finally, after making a cut to separate the signal from the background you will have a recreated histogram that has a high chance of containing a supersymmetric particle.